

iMS View Virtual Instrument Software
- One platform for PVIB2.0, HDAQ and iSD-400 instruments and modules, with a unified module management window
- Paired with the iMS Server device manager: connect a device and the matching application is detected and launched automatically
- A closed loop from acquisition through analysis to reporting: live display and analysis, optional real-time storage, and WYSIWYG Word report output
- Rich time- and frequency-domain algorithms — integration, differentiation, digital filtering, FFT amplitude and phase spectra, power spectrum, transfer function and correlation — computed live during acquisition
- Covers voltage, ICP, thermocouple temperature, strain, charge and counter measurements (plus resistance on HDAQ series), with batch import/export of sensor information
- Built for massive datasets: 48 GB+ files displayed in full within seconds, and long recordings automatically reduced to useful segments by peak or kurtosis search
- Opens .dat, .TWav, .wav, .RTWav and .sef files; exports selected channels and time ranges to binary, text or Excel, and supports MATLAB analysis
- Supports secondary development and custom domain-specific modules; runs on Windows 10 and above
Need selection advice or an on-site demo? Use the buttons above and our engineers will reach out shortly.
Feature Walkthrough
Representative screens from the application; the actual display varies with device model and software version.
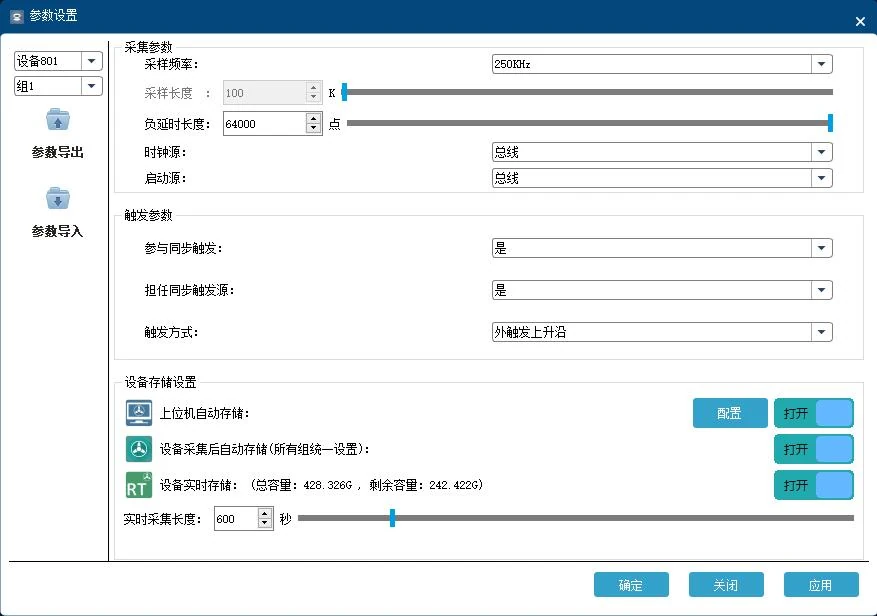
Device parameter setup, pushed straight to the hardware
Acquisition, trigger and storage parameters are configured in a single window and pushed straight to the hardware once set; whole parameter sets can be exported and imported for reuse at the next test site.
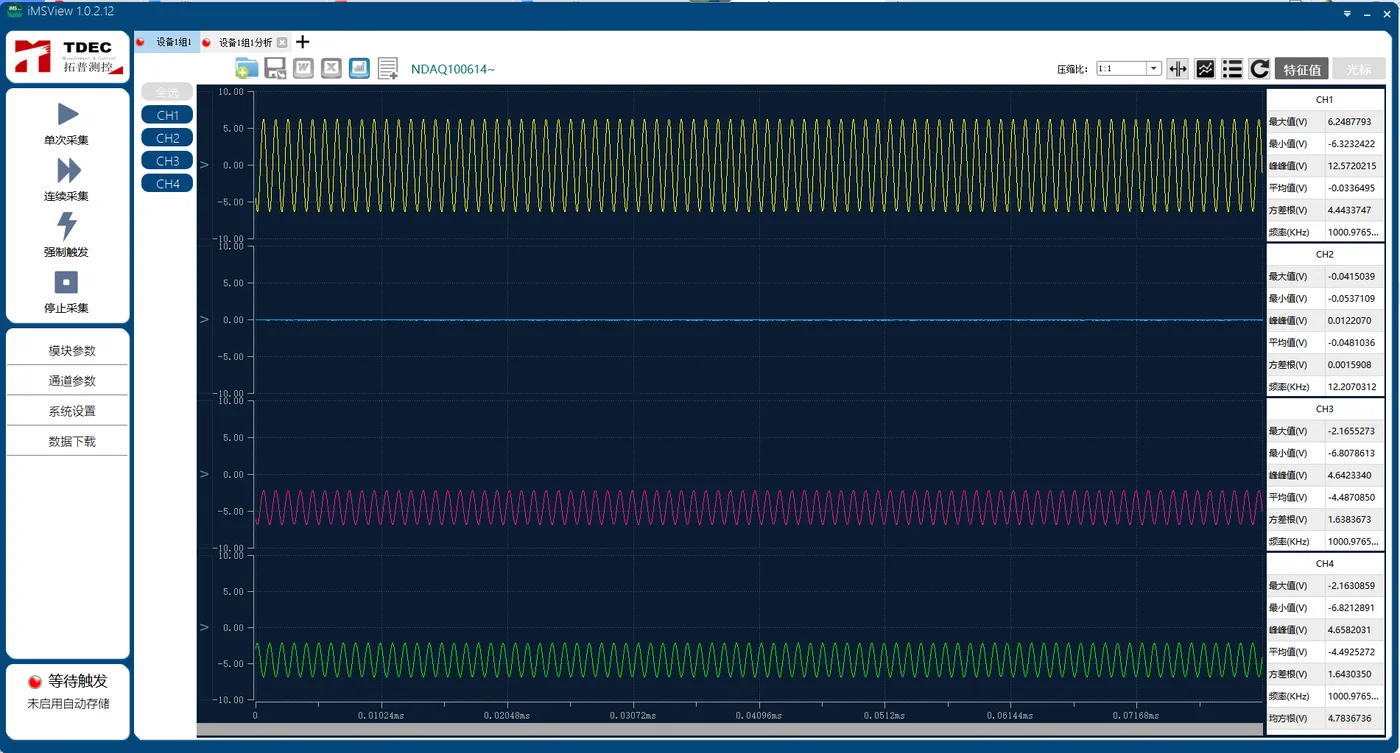
Live acquisition display and real-time storage
Channel waveforms and key values are plotted live during acquisition, with optional real-time storage for long-duration, high-volume recording.
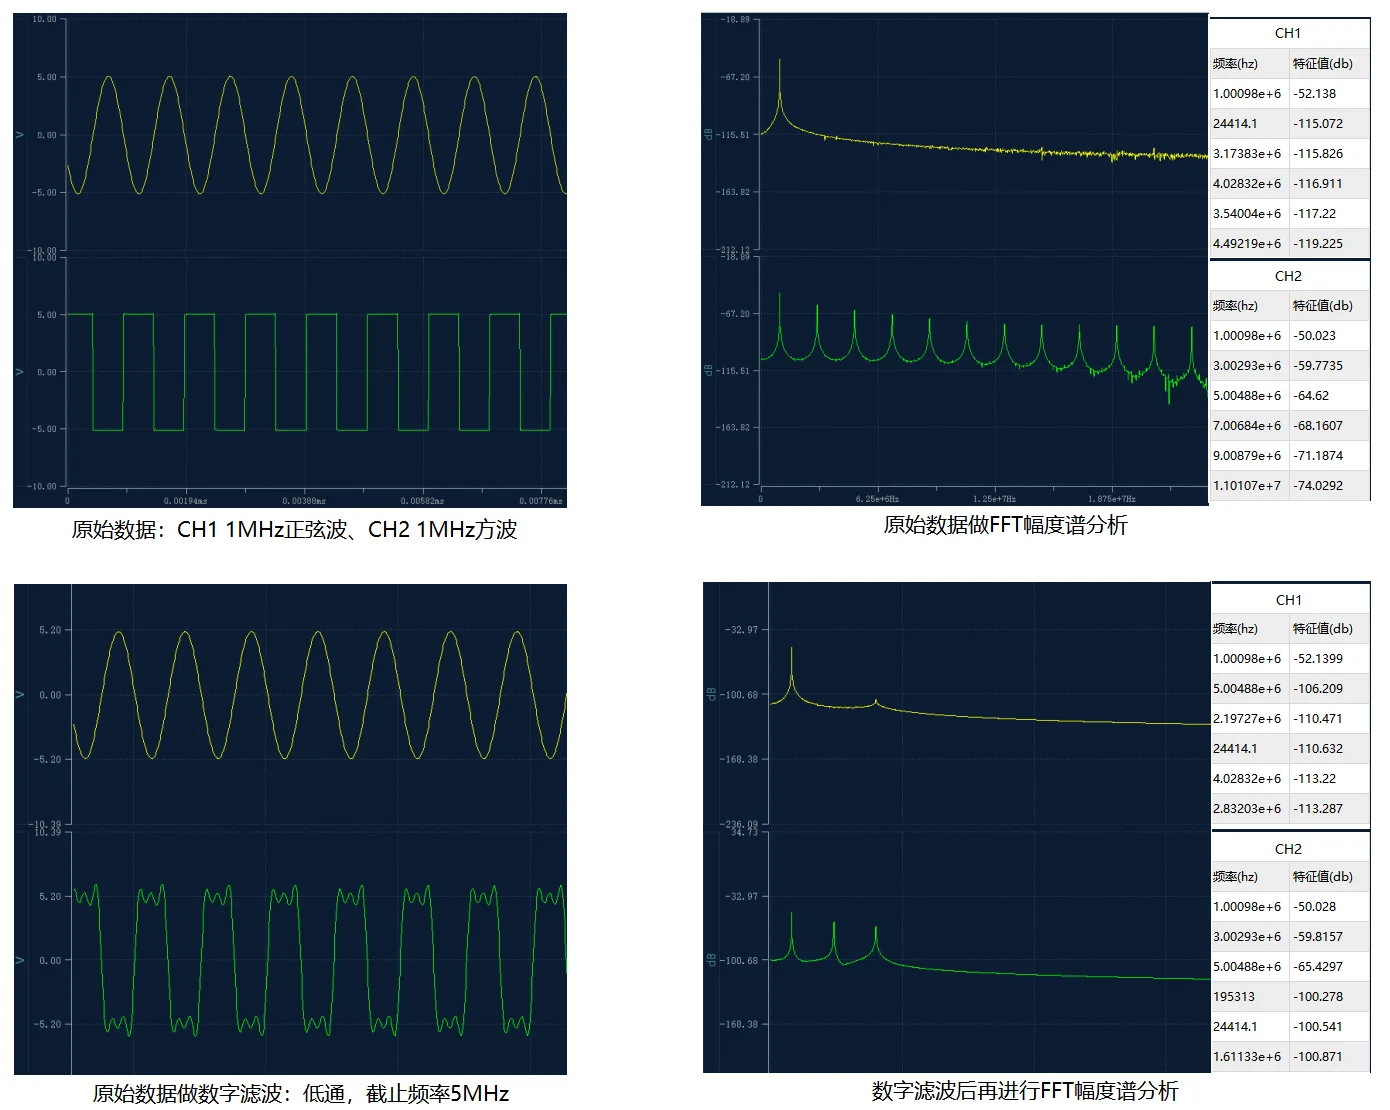
Time- and frequency-domain analysis
Integration and differentiation, digital filtering, FFT amplitude and phase spectra, power spectrum, transfer function and correlation analysis all run and display live during acquisition.
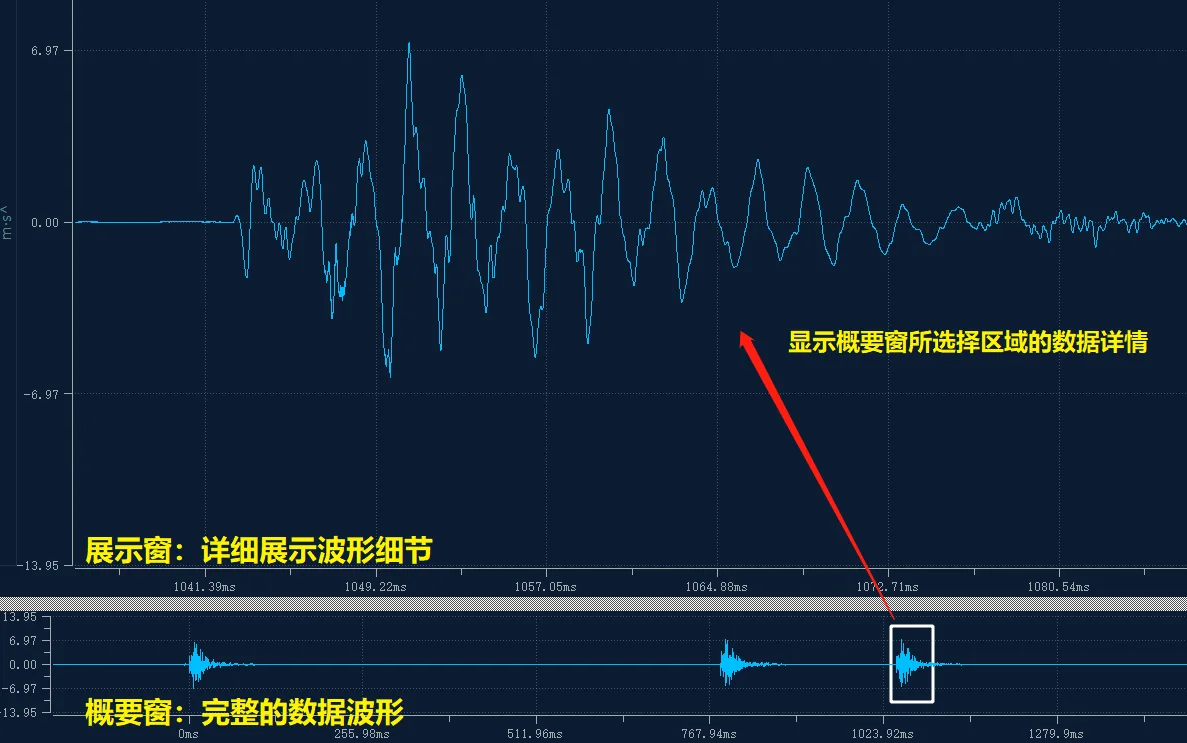
Waveform overview for fast transient location
An overview pane shows the whole record at once; select any region to inspect it in detail, so target events are found quickly even in very large files.
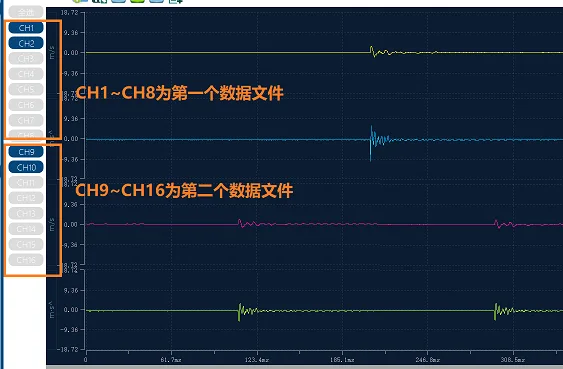
Multiple files on one screen and one time axis
Data files sharing a sample rate can be overlaid on a single time axis, making comparisons across tests straightforward.
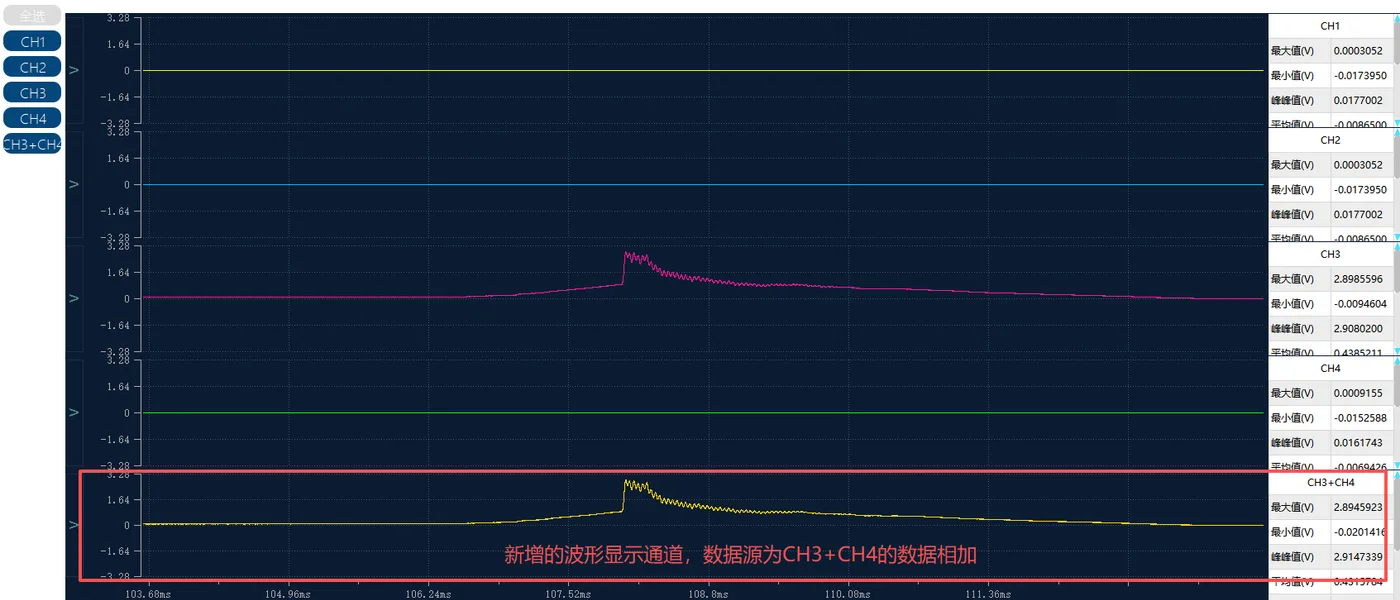
Custom panes and calculated channels
Add display panes, choose their data sources, and derive calculated channels from arithmetic or custom formulas.
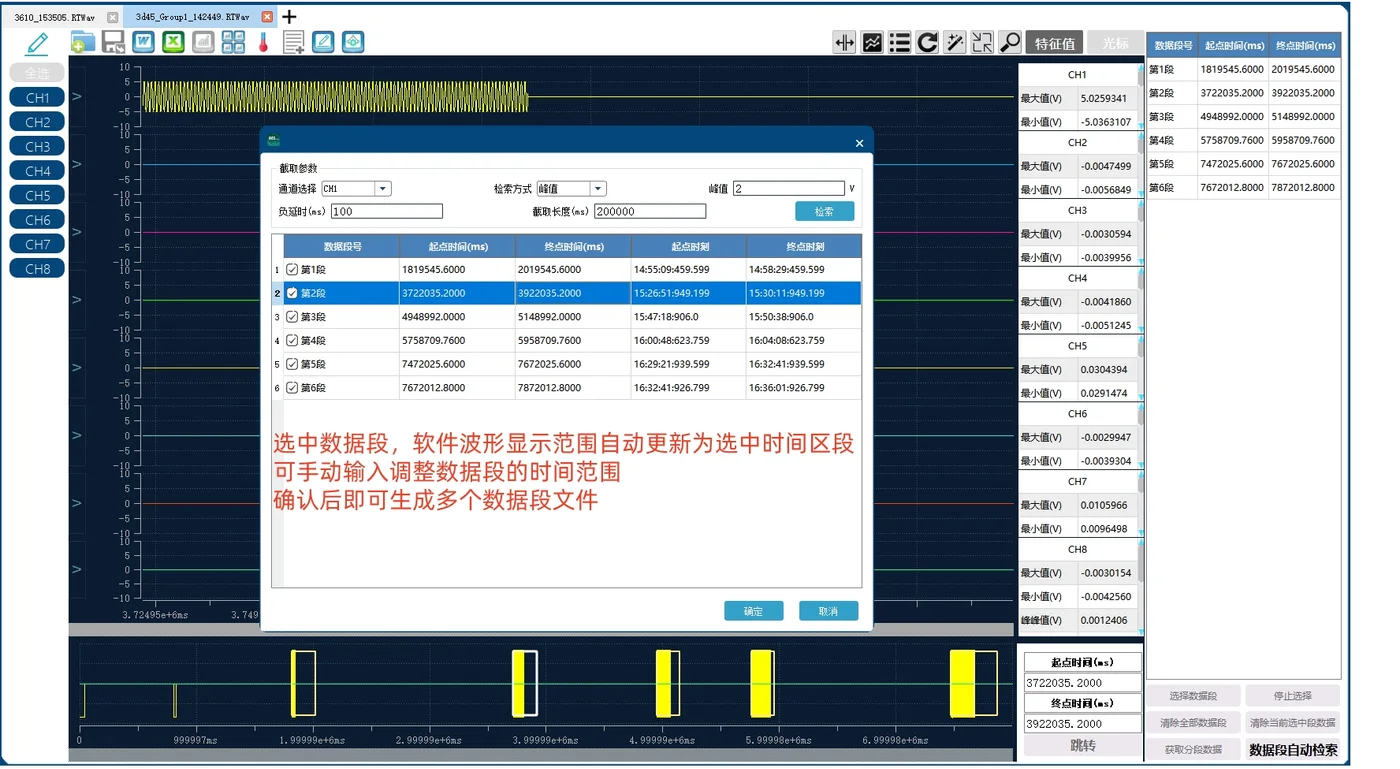
Sub-sampling long records to isolate the useful segments
Long real-time recordings can be searched by peak or kurtosis criteria and split automatically into usable segments, with no manual hunting.
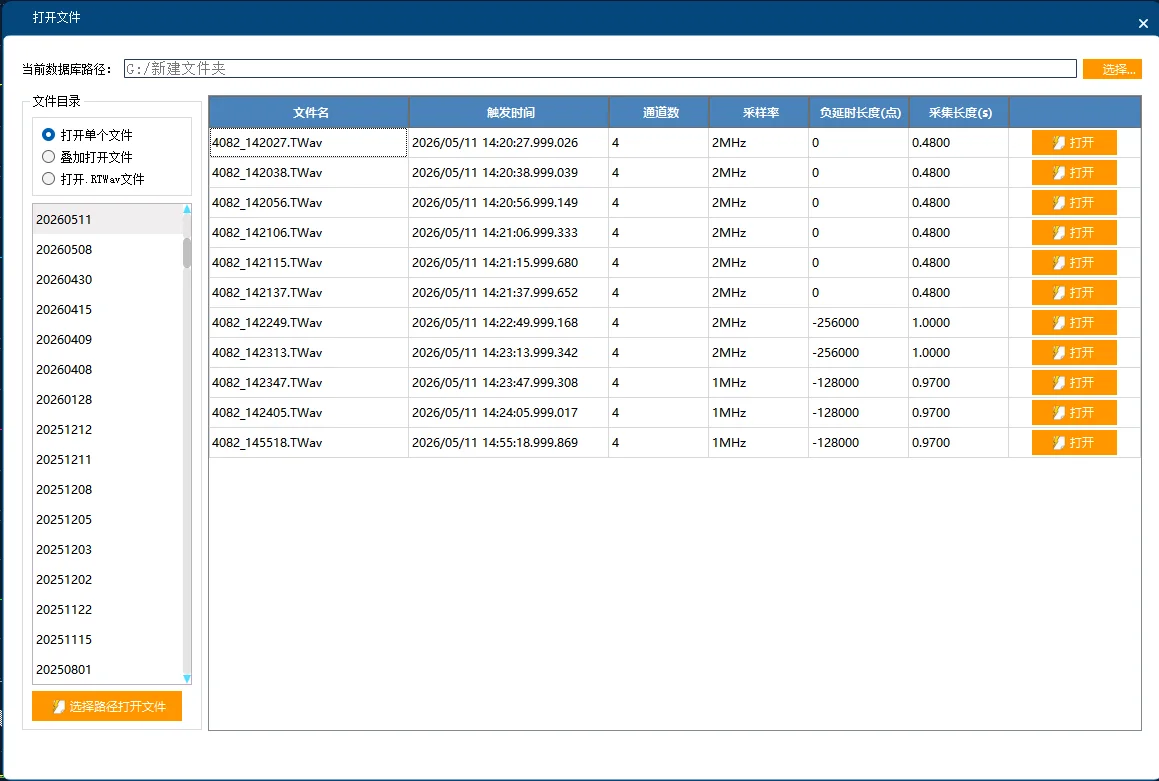
Automatic archiving and multi-format export
Downloaded data is archived by date automatically, with file summaries for quick browsing and opening; export by channel and time range to binary, text or Excel, or generate a Word report directly.
Related scenarios
Downloads
FAQ
- Which devices does iMS View support, and what does it require to run?
- It supports the PVIB2.0, HDAQ and iSD-400 series instruments and modules. Once a device is connected the software detects its type and switches to the matching device page; the application and home screen differ by device. It runs on Windows 10 and above.
- How do iMS Server and iMS View relate?
- They work as a pair: iMS Server is the device manager — communication, device status and application launch; iMS View is the virtual instrument software — device control, acquisition and plotting, analysis and reporting. In practice you open iMS Server, connect the device, and launch iMS View from there.
- What kinds of signals can be measured?
- Beyond general voltage measurement it covers ICP sensors, thermocouple temperature, strain, charge and counter inputs, with resistance measurement on HDAQ series devices. Sensitivity and other calibration parameters live in a sensor library with Excel batch import/export, and sensor settings already stored on a device are detected automatically. Availability depends on the device model and the options ordered.
- How are acquisition parameters and triggering configured?
- Parameters are organised as module settings, channel settings and system settings, pushed to the device from within the software. Triggering supports manual, internal (rising edge, falling edge, window-exit, window-entry), external, and combinations of internal and external triggers, with a pre-trigger delay to retain data before the trigger point.
- How long can real-time storage record, and how do I find the useful data in the resulting file?
- In real-time storage mode acquisition and storage run together: the maximum record length is no longer bounded by module buffer size, only by the free disk space on the device. Those files are compressed, so sub-sample before analysis — select segments manually on the overview, or search automatically by peak or kurtosis criteria, generating standard files from the configured pre-trigger and capture length. Real-time storage is an ordered option.
- How do I compare data from several tests?
- Files sharing a sample rate can be shown together on one time axis; alternatively, overlay-open merges selected channels from different files into one, optionally aligned at the trigger zero point, so responses across tests line up directly. Note that an overlaid file must be saved as a new file before analysis.
- Which file formats are supported, and how are results exported?
- It opens .dat, .TWav, .wav, .RTWav and .sef data files. Exports can be limited to selected channels and time ranges and saved as binary, text or Excel, or taken into MATLAB for further analysis; Word reports are generated straight from the waveform view, exactly as displayed.